Learning curve
Learn what a learning curve is, its models, formula, and how to calculate it. Discover learning curve graphs with examples. How and where to apply it.


Discover:
- What is a learning curve?
- The learning curve theory
- Learning curve formula
- Learning curve models and examples
- Pros and cons of the learning curve theory
- Application of the term “learning curve”
- Where to apply the learning curve
- Real world examples of application the learning curve theory
- What is a steep learning curve?
What is a learning curve?
The learning curve theory proposes that a learner’s efficiency in a task improves over time the more the learner performs the task.
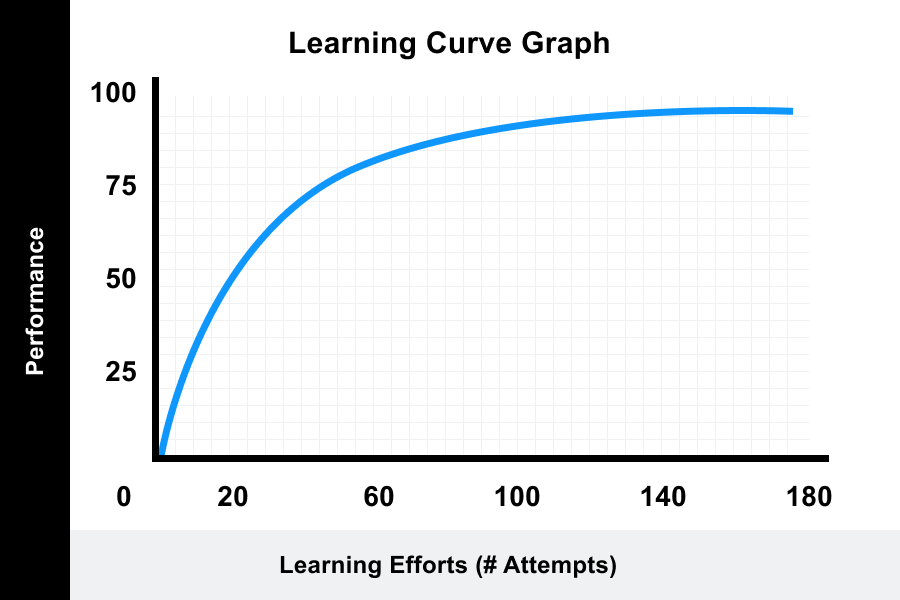
Graphical correlation between a learner’s performance on a task and the number of attempts or time required to complete the task.
The learning curve theory
Ebbinghaus’ forgetting curve
While the term “learning curve” came into use in the early 20th century, Dr. Hermann Ebbinghaus described this theory as early as 1885.
He mostly was focusing on memory studies and developed a forgetting curve theory. This theory helps us to understand how our memory works, and retains information, relating to specific things people attempt to learn.
The modern Microlearning theory is based on Ebbinghaus memory studies. Nowadays it helps us understand when and why we forget certain information and how we can tackle this.
Later, Arthur Bills described the learning curve in his work “General experimental psychology” (Bills, Arthur Gilbert, in 1934, page 192).
In his work, he describes it saying, “the learning curve is a graphical device for picturing the rate of improvement in terms of a given criterion of efficiency, as a result of practice.”
He described two sides of the same process and had presented two learning curve graphs.
The 1st curve of achievement represents an increase in productivity over each unit of trial.
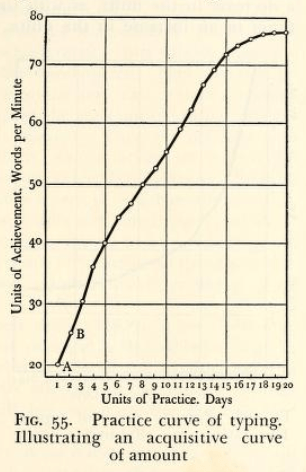
Acqusitive curve of amount – “General experimental psychology” (Bills, Arthur Gilbert, in 1934, page 193)
The 2nd illustrates an eliminative, or declining, curve of time needed to perform the same task.
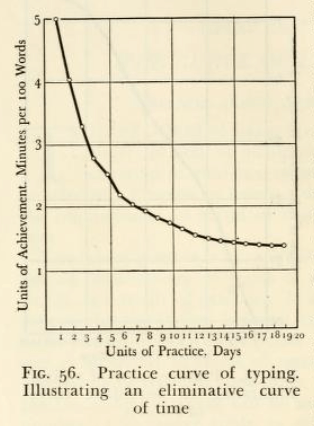
Eliminative curve of time – “General experimental psychology” (Bills, Arthur Gilbert, in 1934, page 194)
Wright’s experience curve
This is the basis for the learning curve formula, the “Cumulative Average Model” (or “Wright’s Model”), which was described by T.P. Wright in 1936 in his work “Factors Affecting the Cost of Airplanes“, after realizing that the cost of aircraft production decreased with the increase in production performance. There are currently different variations of the original formula used today in specialized applications, but the idea remains familiar to the original formula.
The experience curve theory states that the effort to complete a task should take less time and effort the more the task is done over time.
If one were to plot the repeated attempts of a learner against the time taken to complete the attempt, a pattern can be identified indicating that the task takes less time as the learner gains more experience via repeated attempts. The theory can also be expressed as a mathematical function that can be used as a prediction tool.
Learning curve formula
Where:
Y is the average time over the measured duration
a represents the time to complete the task the first time
X represents the total amount of attempts completed
b represents the slope of the function
The formula can be used as a prediction tool to forecast future performance.
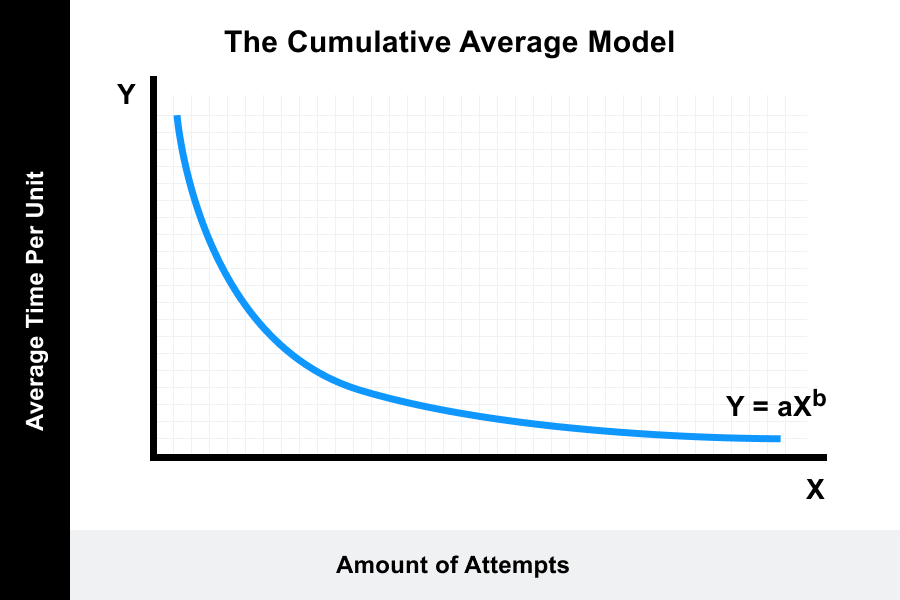
The formula stipulates that the more attempts that are included, the more the overall time will decrease. The formula can be used to predict a learner’s rate of learning of a simple task or even help businesses to predict the production rate of a product.
For a more detailed look at how to use this formula.

The definitive guide to microlearning
The what, why, and how-to guide to inject microlearning into your company.
DOWNLOAD GUIDELearning curve models and examples
Although the theory states that more attempts = a decrease in time, it does not always work out that way. Many factors can impact the end-results, resulting in a variety of different learning curve shapes.
Here are four common types of a learning curve and what they mean:
1. Diminishing-returns learning curve
The rate of progression increases rapidly at the beginning and then decreases over time.
This describes a situation where the task may be easy to learn and progression of learning is initially fast and rapid.
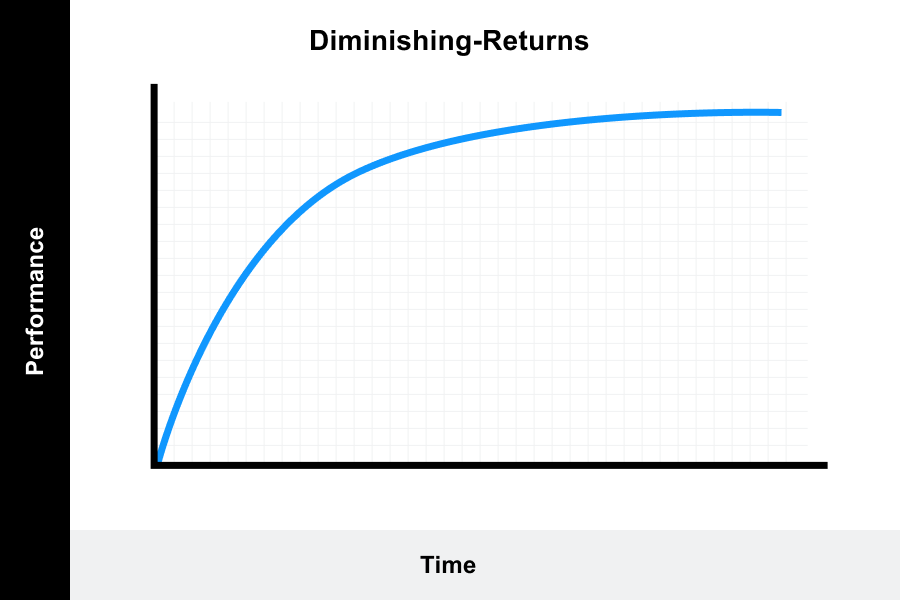
Progression levels off as the learner obtain full proficiency. This could be described as a plateau, where the individual is no longer progressing. It could signal that the learner has reached a limit in their ability or that a transition may be occurring. It could also mean that the individual has lost motivation or is fatigued.
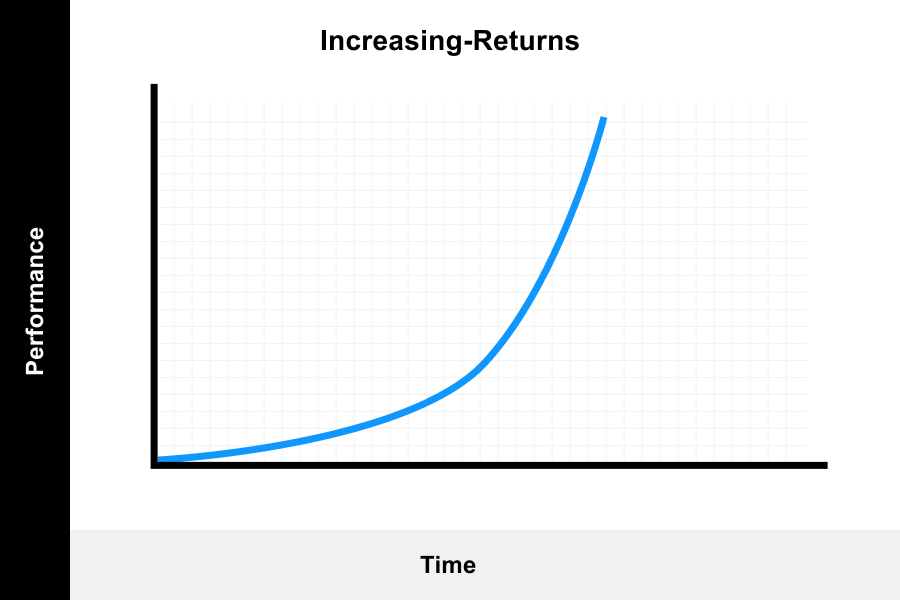
2. Increasing-returns learning curve
The rate of progression is slow at the beginning and then rises over time until full proficiency is obtained.
This model describes a situation where perhaps a complex task is being learned and the rate of learning is initially slow.
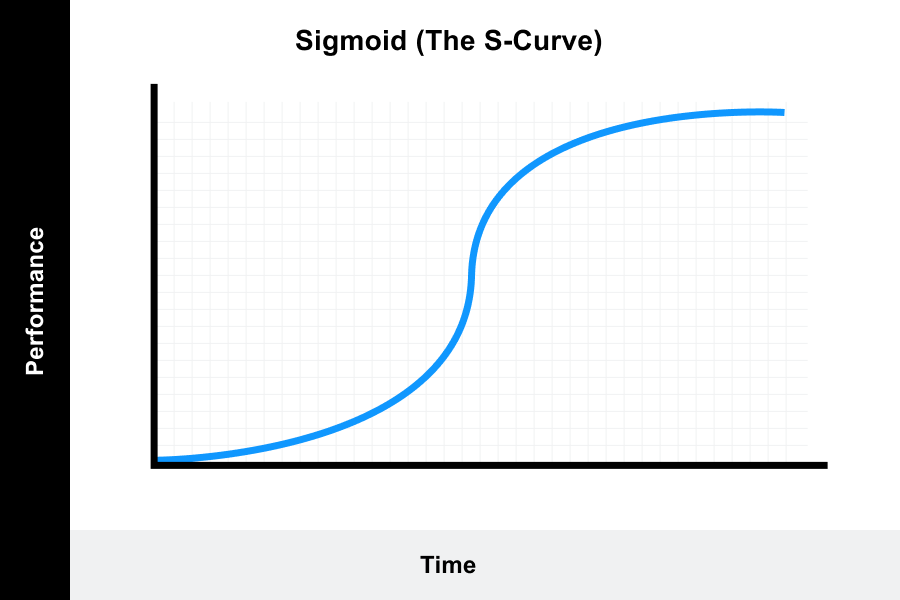
3. Increasing-decreasing return learning curve (the S-curve)
This model is the most commonly cited learning curve and is known as the “S-curve” model.
It measures an individual who is new to a task. The bottom of the curve indicates slow learning as the learner works to master the skills required and takes more time to do so.
The latter half of the curve indicates that the learner now takes less time to complete the task as they have become proficient in the skills required. Often the end of the curve begins to level off, indicating a plateau or new challenges.
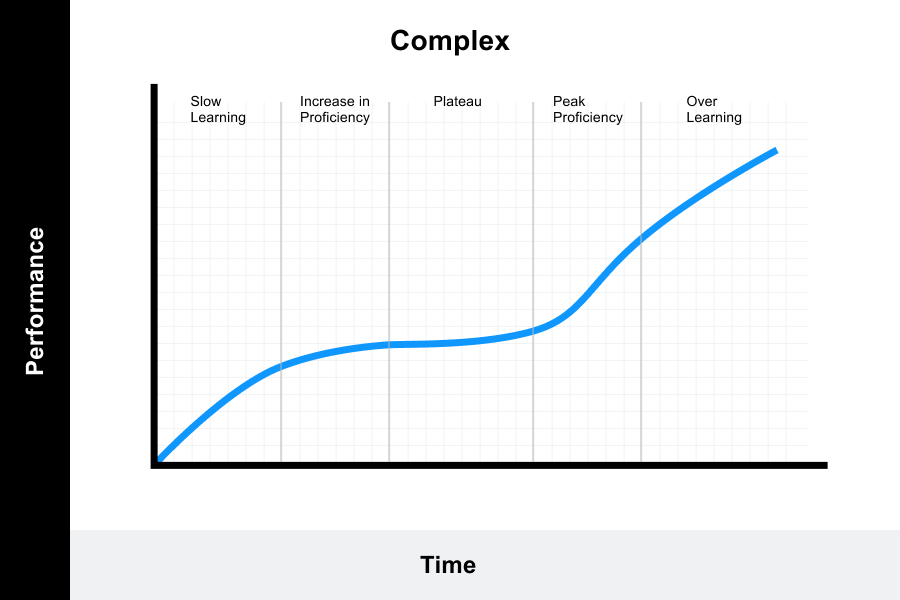
4. Complex learning curve
This model represents a more complex pattern of learning and reflects more extensive tracking.
- The beginning of the curve indicates that learning is initially slow.
- The second stage of the curve shows an increase, which indicates that the learner is becoming proficient in the skill.
- The third stage of the curve indicates that the learner is plateauing in his proficiency once the learner feels he has mastered the skill.
- The fourth stage of the curve represents that the learner is actually still improving the skill.
- The last stage of the curve represents the point at which the skill becomes automatic, muscle memory for the learner, often termed “over learning”.
Pros and cons of the learning curve theory
Pro of the learning curve theory
Using a learning curve can help a business to improve the performance and productivity of their workforce and reduce costs.
When used to track or predict performance, it can provide psychological motivation and strategic planning:
- Performance improvement cannot happen on its own and is connected with learning. By incorporating a learning culture within the organization where employees are encouraged and supported to keep learning, performance levels can be expected to increase on the curve.
- The rate of learning is also considered to be consistent enough that trends can be established using the learning curve, enabling better forecasting and business decisions.
Cons of the learning curve theory
As a con, a learning curve is very dependent on assumptions made about performance. As mentioned earlier, many variables can impact learning and future performance:
- Using a learning curve to predict overall performance of larger groups or processes means that many assumptions are made on variables like motivation, sociological factors, workplace dynamics, training resources, and previous knowledge or experience.
- A learning curve that may not show expected results would need further analysis to determine the underlying variables impacting its shape, as the curve does not tell the whole story.
Application of the term “learning curve”
Two applications of the term “learning curve” can be found:
Generalized
The learning curve is often used in colloquial speech to describe the time and effort required when learning something challenging.
The application can be broad and generalized, such as describing the learning curve involved in learning to read. In these scenarios, a graphical representation using mathematics is not being applied to explain learning progression. The term is therefore used as a qualitative description of learning progression over time.
Measured
The other application of learning curve is quantitative, where mathematical models are created to represent the rate of proficiency or mastery of a task.
This learning curve model is only applicable when used to measure the real rate of progress for completing a specific task against time. The task needs to be repeatable, measurable, and consist of only one variable within a procedure; it cannot measure an entire procedure on its own.
Where to apply the learning curve
There are many variables in learning that impact the rate of progression and cannot be accurately reflected in the learning curve model.
In the example of learning to read, the variables could include phonetics, vocabulary, type of reading material, teaching methods, motivation, previous knowledge or experience, quality of practice, and much more.
The learning curve model requires that one variable is tracked over time, is repeatable and measurable. Individual motivation, for example, would be difficult to measure. As a whole, learning to read is a complex procedure involving many variables and is not ideal for a learning curve.
An example of where a learning curve can be applied could be a measurable task like a factory worker learning to operate a new machine that requires specific, repeatable steps. As the worker learns to operate the machine following the procedural steps, he becomes faster and more proficient at using it. A learning curve would measure this rate of progression and mastery.
The learning curve model is used most commonly in organizational or industrial management to improve output by way of improving the performance of the human workforce.
The model was widely applied during World War II (WWII) when it was realized that the cost of aircraft decreased with the increase in production performance. It was later taken up by the industrial and business sector for a variety of performance improvement applications.
Real world examples of application the learning curve theory
The learning curve is known by different names partly due to its wide variety of application.
Terms used to describe the learning curve include:
- experience curve,
- cost curves,
- efficiency curves,
- productivity curves.
The model can be used to determine how long it takes for a single person to master a skill or how long it takes a group of people to manufacture a product. In most applications, the “learning” in the curve is actually referred to as process improvement.
Let’s take a look at some different examples of where the learning curve is being applied today.
Industry
Manufacturing costs as related to workforce performance can be tracked by using the learning curve. Instead of performance and number of attempts, the values could be unit cost or unit labor hours and cumulative production in units. As workers produce more product, the per-unit cost will often decrease.
The learning curve can be used to predict potential costs when production tasks change. For example, when the pricing of a new product is being determined, labor costs are factored in.
If a product takes two hours to produce, the product is released to the market for sale at a cost that reflects the two-hour production period plus other associated costs and markups.
But what if the production time was based on the first few attempts? What if by the 100th time the product was produced, production time is reduced to one hour? The product would be on the market at a price that is much too high, resulting in potentially lower sales. Using the learning curve can provide additional insight for planning purposes.
Business
Learning curves can also be applied to organizational performance using either the generalized approach or by conducting a measured analysis. Determining which approach to take depends on whether the desired performance can be directly measured.
For example, employees learning a difficult task, such as learning to use a complex software program, may have poor performance at the beginning due to the inherent difficulty of the task. If the goal is that employees need to know how to use the software in their day to day tasks, this may be difficult to measure as it involves many variables. By applying the learning curve theory as a framework, organizations can still benefit.
The learning curve as a framework can help organizations to understand in this scenario what is required to become proficient in the software. If training support and time to practice are identified as important factors, then it can be seen that employees who are given support and time to practice with the software will over time have better performance than employees who are not given support or time to practice.
If the software is important for productivity, then employee performance could decrease over time if employees cannot effectively use the software. Organizations can then provide additional support or resources needed.
To utilize a measured learning curve, organizations would need to identify a specific variable to analyze. For example, an organization seeking to improve the performance of customer service could decide that the implementation of a new initiative (# of attempts) would result in a decrease in customer complaints (performance). The organization could track and analyze the repetitive practice of this initiative over time to determine if indeed customer complaints decreased over time.
Medicine
For surgeons in the operating room, many procedures will involve the same repetitive tasks.
Because a surgeon is essentially practicing the same skill over and over whenever that procedure is done, the learning curve can be applied to show individual learning and performance over time.
This enables not only insight into the improvement that the surgeon is achieving, but aides instructors with identifying where more resources and assistance can be directed to improve performance.

Use learning data to accelerate change
Understand learning data and receive a practical tool to help apply this knowledge in your company.
Download workbook