Valamis Product Buzz – New Reporting Suite

Why have we created a whole new reporting suite?
At Valamis, we’ve always had a passion for being at the cutting edge of data science. We have a long history of developing data analytics to solve the challenges faced by our customers, and over the past few years, those challenges have changed a lot. That’s why we’ve been working in partnership with our customers to create a brand-new reporting suite to solve these fresh challenges and support them with the (sometimes daunting) world of reporting.
Learning data and analytics are powerful tools when it comes to engagement and encouraging employee development. For organisations, this is (or should be) much more than just compliance training; it’s about talent development, upskilling and reskilling through meaningful learning experiences.
L&D and HR teams are increasingly asked to produce more in-depth metrics to demonstrate the ROI (return on investment) of a learning system investment or how learning strategy has helped to drive a company’s objectives forward. In fact, many learning leaders are looking to data to help them make smarter decisions. Learning analytics can provide proof of these concepts by quickly and accurately providing an even more detailed insight than ever before.
What are some of the benefits?
At Valamis, we have some amazing data scientists who are experts on big data. We don’t expect you to be a data scientist though! That’s why our reports are 100% intuitive and easy to understand – whatever your background is. Need more support or advice? Our experts are on hand to train and help you get the most from your data, and we understand that it’s not just the data that matters – but it’s what you do with it that’s important.
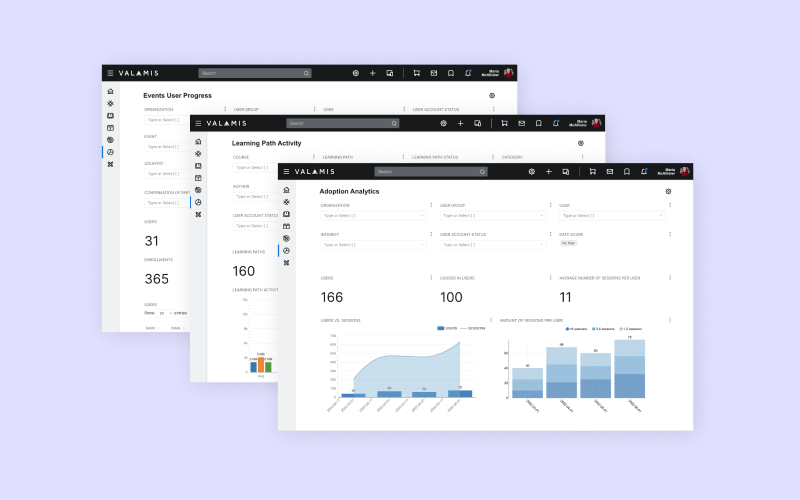
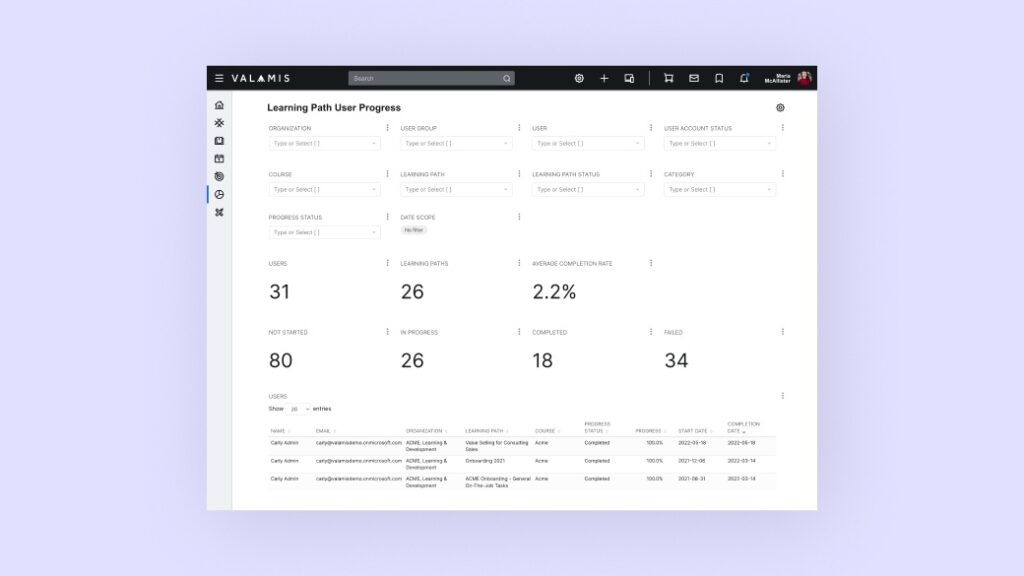
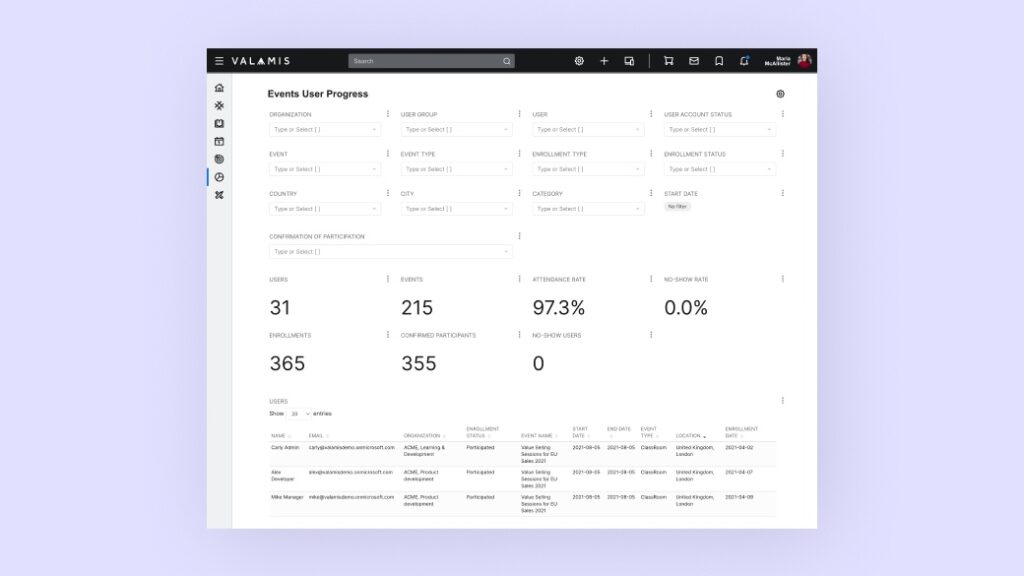
What do the new reports do?
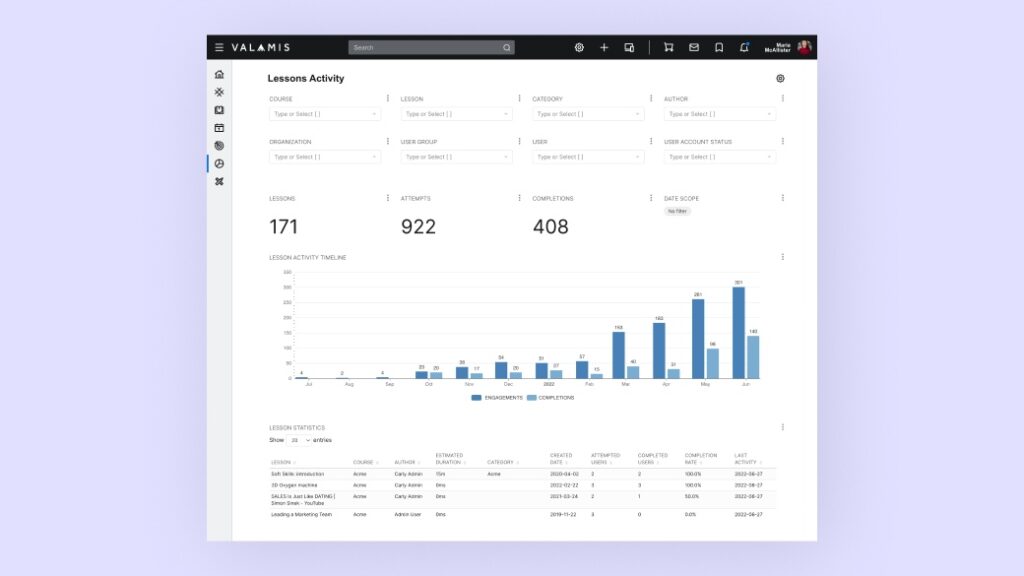
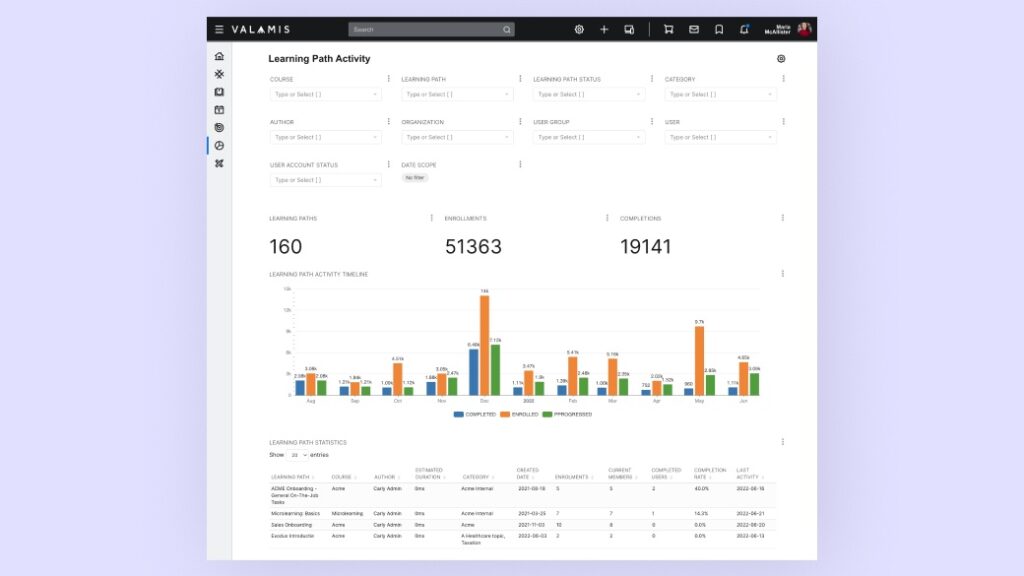
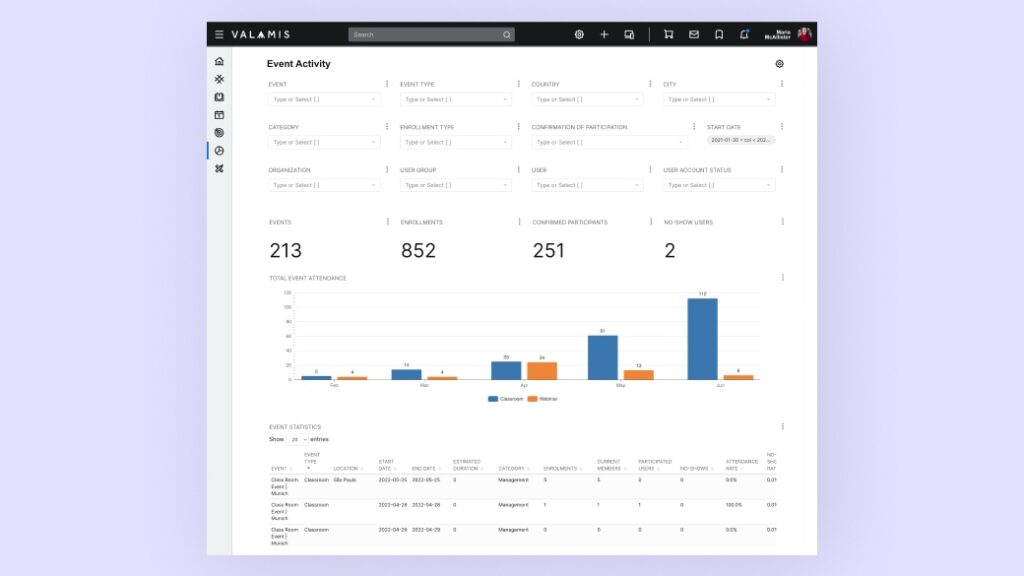
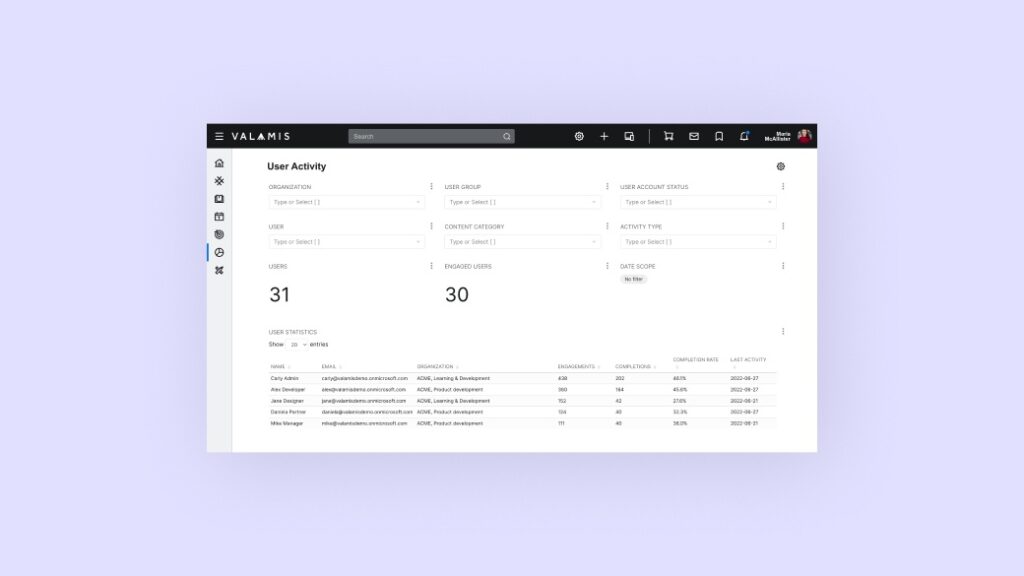
Additionally, we’re continually developing and updating our reporting solution, and we’ll update you with new releases and future developments as we plan and release them.
Our experts are here to support you
The Valamis data scientists would love to discuss your reporting needs and help to solve your data problems with clever solutions. Get in touch with us and discover our new reporting solution in action. To learn more, download our Workbook on Learning Data written by our experts to help leverage learning data to impact business initiatives
See it in action
Book a demo call now and let us help you connect the dots between learning and business success.
Book a demo now!